1 - Use a selection index based on a balanced breeding objective
Selection Indexes allow you to make balanced selection decisions. They take the hard work out of knowing how much emphasis to put on each individual trait by ranking animals on their overall genetic value for a particular production system and value along the entire production chain.
Selection Indexes are calculated using the BreedObject™ software that has been developed by the Animal Genetics and Breeding Unit (AGBU) at the University of New England. BreedObject™ combines the BREEDPLAN estimated breeding values (EBVs) of an animal with an economic weighting on each individual trait (based on costs of production and returns on output) to produce a single selection index value for each animal.
Selection Indexes enable cattle producers to make 'balanced' selection decisions, by taking into account the relevant growth, carcase, birth and fertility attributes of each animal, to identify the animal that is most profitable for a particular production system.
An animal’s selection index value can effectively be interpreted as its EBV for profitability in a particular commercial production scenario and market. Ranking seedstock animals (for example bulls in a catalogue) on their selection index value sorts them based on their progeny’s expected profitability for the targeted production system.
Selection index values are expressed as differences in 'net profit per cow mated' and reflect differences in profitability across the entire production chain - from joining to slaughter. In indexes designed for self-replacing production systems (maternal), the long term profit generated by the sire’s daughters is also included.
A number of breed societies have generic, market-based breeding objectives and selection indexes available on their respective websites, allowing commercial breeders to search for bulls that fit within their target index specifications (see Tool 4.01). These indexes are a very good guide as the objectives for many enterprises will be similar and rank animals similarly.
The breed-based indexes have been calculated from very good industry feedback on the costs, returns and trait performance levels of the production system and market being supplied. Most commercial producers would be well advised to start with one of the standard breed society indexes and modify their selection procedures using a process described in Procedure 4.
When selecting bulls using dollar index values it is important to also consider the individual EBVs and your herd situation. This concept is covered in more detail in Procedure 3.
If your production system and target market are substantially different to those for which breed society selection indexes are based there is scope to develop your own specific breeding objective and associated selection index using BreedObject™ software.
An example of a breed society selection index*
In this example for a Bos taurus breed, the genetic differences between animals in net profitability per cow joined are estimated. The breeding goal is a high fertility, self-replacing commercial herd selling feeder steers and heifers for the short fed domestic feedlot trade.
Steers are assumed to be marketed at 445kg live weight (245kg HSCW and 10mm P8 fat depth) at 15 months of age. Emphasis is placed on growth to 400 days and high carcase yield while maintaining fertility and marbling. The key economic traits that are important in this selection index are shown in Figure 1. The different trait emphases reflect the underlying profit drivers in a commercial operation targeting the short fed domestic markets.
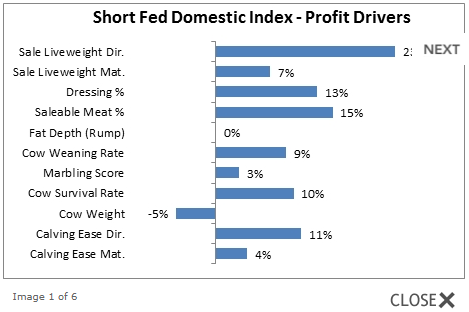
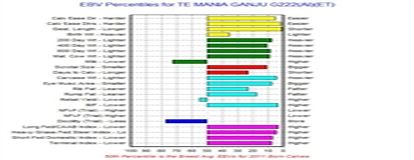
Figure 1: Example of the relative importance of objective traits at the genetic level for a specific breeding objective
BREEDPLAN EBV weightings are formed using knowledge of the genetic relationships between the key profit drivers and BREEDPLAN EBVs (Figure 2). For this selection index, there is a high emphasis on greater 400 day weight EBV and shorter Days to Calving EBV.
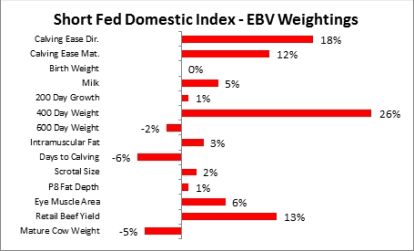
Figure 2: BREEDPLAN EBV weights for the Short Fed Domestic Index
It is also possible to predict the response in individual traits (EBVs) if the above selection index is used (Figure 3). In this example, the 600 day weight EBV is expected to increase even though there was a negative weighting for it (see Figure 2). This is primarily associated with the strong genetic relationship between 400 day weight EBV and 600 day weight EBV and the strong weighting on 400 day weight.
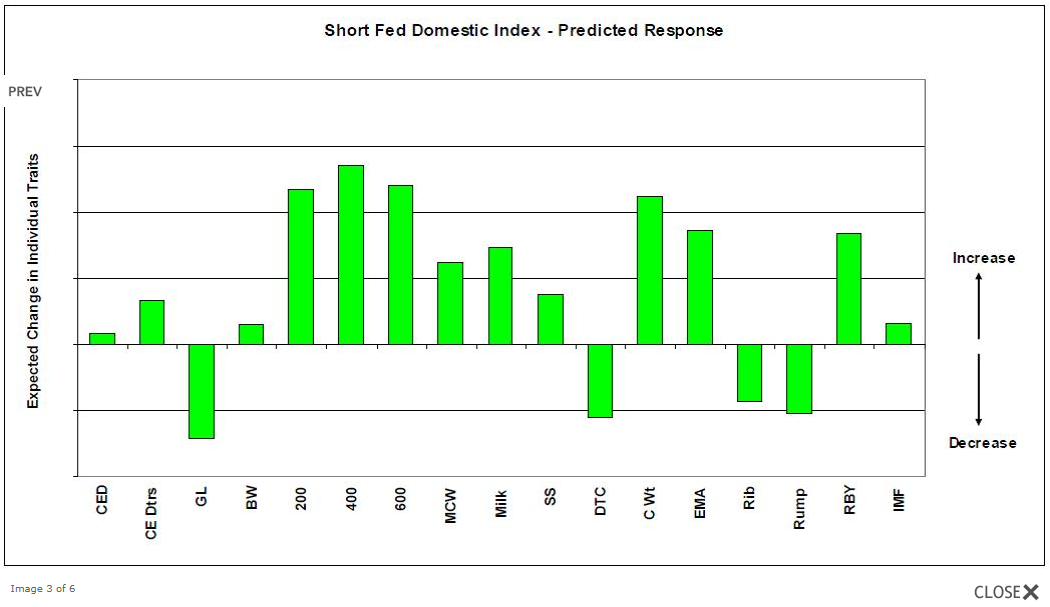
Figure 3: Predicted response in individual traits (EBVs) using the example selection index.
*This material in this breakout box has been adapted from material from the websites of BREEDPLAN and the Angus Society of Australia.
Understanding and interpreting BREEDPLAN EBVs
What is an EBV?
An animal’s breeding value can be defined as its genetic merit for each trait. While it is not possible to determine an animal’s true breeding value, it is possible to estimate it. These estimates of an animal’s true breeding value are called Estimated Breeding Values or EBVs. EBVs are reported in the units in which the measurements are taken (eg kilograms for the weight EBVs).
EBVs are expressed as the difference between an individual animal’s genetics and the genetic base to which the animal is compared. The 'genetic base' can roughly be described as the historical genetic level of that particular breed. For most breeds, their genetic base will have been set in the late 1980’s and is based on the first 200 animals’ records for that breed.
Importantly, the genetic base for each breed will be different, so only EBVs for animals within a particular evaluation can be directly compared. Putting this in practical terms, a 600 day weight EBV for a Hereford bull is not equivalent to the same EBV for an Angus Limousin bull, even if they all have the same EBV for that trait. This means it is difficult to compare EBVs of different breeds.
Interpreting BREEDPLAN EBVs
There are four key considerations when assessing BREEDPLAN EBVs for a particular animal:
- compare with current breed average and percentile bands
- compare EBVs to estimate the difference in output between two sires
- consider EBV accuracy
- visual appraisal
As most breeds have experienced significant changes in their genetic merit for most traits since the mid 1990’s, the first step when interpreting an EBV should be to compare it to the current averages of the EBVs for the breed. This will give you an indication of how the animal compares with the current genetic average for each trait. This can be taken further by comparing the animal’s EBVs to the Percentile Bands Table to assess exactly where the animal ranks within the breed for each trait. As with the breed average EBVs, a Percentile Bands Table should be provided in all BREEDPLAN reports and sale catalogues.
|
In the example below using 600 day weight EBV, the breed average for 2011 born calves is +92 whereas the 600 day weight EBV of the animal is +112. The accuracy of the 600 day weight EBV is 73%. Based on the percentiles reported in Figure 4, the animal is in approximately the top 8% of the breed for 600 day weight EBV. Comparing the bull’s EBVs below with 2011 born breed average animals shows a difference in 600 day weight EBV of 20kg. As an average, half of this difference will be passed on to the progeny. It can then be estimated that calves from the first bull would be on average 10kg heavier at 600 days than those from a breed average bull for 600 day weight EBV. Extending this to a single year’s drop of 50 calves, this difference equates to a potential production difference of 500kg in live weight by the time the calves reach 600 days of age. It is important to note that in the above example we are assuming both bulls are used over dams of similar genetic value/breed and their progeny are run under similar conditions. Figure 4: An example of BREEDPLAN EBVs for an animal registered with Angus Australia Figure 5: Comparing percentiles for each BREEDPLAN EBV and $Index |
$Indexes are discussed in Procedure 3.
When evaluating any EBV, it is also important to consider the EBV accuracy. By definition, an EBV is an estimate of an animal’s true breeding value. To provide breeders with a measure of the reliability of the estimate, BREEDPLAN produces an accuracy figure with each EBV. This accuracy provides a measure of the stability of the EBV and gives an indication of the amount of information that has been used in the calculation of that EBV. The higher the accuracy the lower the likelihood of change in the animal’s EBV as more information is analysed for that animal, its progeny or its relatives.
The following guide may be useful for interpreting accuracy:
- Less than 50% accuracy - the EBVs are preliminary. EBVs in this range will have been calculated based on information on parents and relatives only. These EBVs could change substantially as more direct performance information becomes available on the animal.
- 50-74% accuracy - the EBVs are of medium accuracy. EBVs in this range will usually have been calculated based on the animal’s own performance and pedigree information.
- 75-90% accuracy - the EBVs are of medium-high accuracy. EBVs in this range will usually have been calculated based on pedigree, the animal’s own performance plus the performance of a small number of the animal’s progeny.
- More than 90% accuracy - the EBVs are a high accuracy estimate of the animal’s true breeding value. It likely EBVs will remain stable with addition of more progeny data.
As the number of bulls in a team increases the accuracy of the ‘group’ EBV for the bulls in the team increases (Figure 6). If the accuracy of 3 individual bulls for a trait is 60%, then the group accuracy is 89%. The biggest gains in group EBV accuracy are observed when the accuracy of individual bulls is low. This concept is particularly relevant for cattle producers who are purchasing several bulls or have multiple sire mating as it provides strong evidence that across the team on average the genetic merit has been accurately estimated.
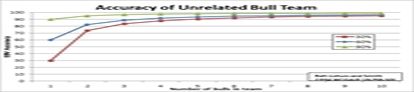
Figure 6: Increase in EBV accuracy as number of bulls in a team increases
Although the accuracy of an EBV should be considered, animals should be compared on EBVs regardless of accuracy. However, where two bulls have the same EBV and there are no obvious visual faults, the bull with the higher accuracy would normally be used more heavily than the bull with the lower accuracy because the results can be predicted with more confidence.
What to measure and when
Annually review any changes that have been made to your production environment or target market. If significant changes have occurred, you may need to reset your breeding objective.
