4 - Determine carrying capacity and stocking rate
Firstly some universal understanding of terminology is required. This includes:
- dry sheep equivalents
- body condition scores
- carrying capacity
- stocking rate
Dry sheep equivalents (DSE)
As the energy needs (and therefore the feed requirements) of livestock differ not only between stock type but also between life stages, grazing management can be made simpler by using a common measure for all types of livestock.
Dry sheep equivalents (DSEs) are the most common unit used when comparing the feed and energy requirements for different classes of stock, including cattle. It is also a valuable measure when matching stocking rates to available pasture.
The conversion weights applied to different livestock will vary depending on the model you use (and the ratings the model uses), so it is important to decide on the model that you believe best applies to your livestock and always use that model, rather than switching between different ratings.
The NSW Department of Primary Industries defines 1 DSE as a 50kg Merino wether, dry ewe or non-pregnant ewe that is maintaining its condition. See Table 6 for the ratings of different stock classes.
Why are DSEs important?
DSEs are an important tool when matching your stocking rate to the available feed in a paddock. It is also useful if you run other types of livestock on your property, such as sheep or goats, as you can then compare different types of animals using the same measures.
100 cattle are not always 100 cattle
For example, the feed in your top paddock may support 100 dry cows at maintenance for 90 days but will only support 100 pregnant cows for 50 days as they require additional nutrition for calf development and lactation.
Class of cattle (British breeds) |
DSE at specified live weights |
|
Weaned calf
|
200kg
|
250kg
|
Yearling
|
400kg
|
500kg
|
Mature cattle
|
400kg
|
500kg
|
Note: These ratings apply to British breeds of beef cattle, if you have Bos indicus cattle alternative models/ratings should be sought.
What is Body Condition Scoring (BCS)?
A national system of objectively descriping cattle in low body condition has been introduced, with a focus on managing for animal health and welfare. The new rating system includes a BCS of 0 for very low condition animals.
The new system replaces the traditional descriptions such as poor, backward and weak that have not been well defined and are subjective, and their use is now discouraged.
Many producers find it easier to base their management decisions around livestock rather than around pastures. However changes in the condition of cattle can be relatively slow to respond to changes in feed quality and quantity. Therefore it is important to use BCS in conjunction with estimates of pasture condition.
Conducting BCS on a regular basis will tell you how your livestock are performing on the available feed, so it can be a powerful tool to use in conjunction with estimating pasture condition.
Read A national guide to describing and managing cattle in low body condition
When to assess BCS
Ideally, you should assess BCS of your livestock on a monthly basis, as this will give you a reasonable lag time since changes in pasture condition occurred. You should also assess BCS at the same as you assess pasture condition.
A good time to do these assessments is when you are doing water/mill runs, as you are likely to see cattle at watering points. In other words, the assessments don’t need to be considered as another job, but simply part of an existing one. Get in the habit of making BCS and pasture assessments as you drive past cattle and through paddocks.
Another important time to do body condition scoring is at joining, calving and weaning, to give you important feedback on the reproductive performance of your cattle, as there is a strong correlation between BCS of cows at calving and their future reproductive performance.
Important points when assessing BCS
- You only need to assess 25 animals to obtain a statistically correct average for a mob, making it a relatively quick task.
- Each animal assessment should only take a matter of seconds. Therefore to get an average for the mob should only take 2 minutes or so.
- When assessing a mob, make sure the 25 animals you select are all the one class, eg all weaners, dry breeders, or lactating breeders. Do not mix classes and especially do not mix lactating and dry breeders.
- Make sure your sample of 25 animals is random, so don’t select the best looking animals.
- When assessing BCS, it is also preferable to feel the animal but not essential, especially with short-haired cattle. It will only be critical to feel cattle if they are very hairy as the hair can make it difficult to see the condition of the cattle.
Body condition scoring of beef cattle
The fat cover over the loin area between the hip (hook) bone and the last rib is the major location on the animal's body used for condition scoring, especially in thin animals. It is measured by placing your hand on the loin area, fingers pointing to the opposite hip bone. With your thumb, feel that fat cover over the ends of the short ribs.
Since there is no muscle between the end of the short ribs and the skin, any padding felt by the thumb will be fat. In cows that score above 3, the short ribs can no longer be felt, even with firm pressure. Therefore, in fatter cattle, the fat cover around the tail head and over the ribs is also used to assess the animal's condition score. Half measures (eg 2.5) can also be used here.
Carrying capacity and stocking rate
A major driver of natural resource condition trend is the level of total grazing pressure over time. Managing grazing pressure so that a negative trend in condition is avoided requires an understanding of the carrying capacity of your property and individual paddocks and how these differ to stocking rates. It is also important to know how to measure both and how to manipulate the stocking rate in order to not exceed carrying capacity.
Firstly it is important to understand the main terms. The terms Carrying Capacity and Feed on Offer (FOO) are often used interchangeably and refer to how much feed (the supply of feed) is available in a particular time frame. This procedure will refer to carrying capacity.
Carrying capacity can be estimated over long and short time frames. The long term carrying capacity is the average number of animals that a pasture can be expected to support over a long term planning horizon (10–15 years) and the short-term carrying capacity is the number of animals that a pasture can support for a set period of time; say a week, month, season or year.
It is important to stick to one time frame or the other when using carrying capacity figures, as obviously the short-term figures are far more variable than long-term estimates. In this procedure, we will refer to the short-term carrying capacity, which is usually measured as grazing area (ha) per dry sheep equivalent (DSE).
Stocking Rate refers to the number of animals or DSEs currently grazing an area of land (i.e. the demand for the available feed). Stocking rate is usually expressed in grazing area (ha) per dry sheep equivalent (DSE) for a nominated period of time. As stocking rate uses the same units as carrying capacity it is important to be clear which figure you are working with at the time.
A pasture or paddock’s stocking rate will change with seasonal conditions and animal reproduction, mortalities, transfers in/out and the impact of non-domestic grazers.
It is important to understand the difference between the two terms so keep in mind:
Supply = carrying capacity
Demand = stocking rate
Another aspect that is important to remember is that both carrying capacity and stocking rate are a function of both stock numbers and time. The length of time the feed will last is a function of how many stock will graze it (carrying capacity), and how many stock can graze the available feed is a function of how long we need to make the feed last (stocking rate).
To better reflect the impact of time in the estimation of carrying capacity and stocking rate, DSE days per hectare (DDH) can be used. These units take into account both stock numbers and time.
Factors to consider when estimating carrying capacity
Estimating the carrying capacity of a property is no easy task due to scale and the variability in land and vegetation types. However with practice and regular checking of your estimates, accuracy will improve quite quickly.
When estimating the amount of feed available to be eaten (carrying capacity), bear in mind the following factors:
- Do not include feed you know the stock will not eat (non-palatable plants).
- Aim to leave 40% to 50% of the available feed to ensure the plants can grow again, rather than letting animals graze all of the plant/pasture.
- Determine a realistic grazing radius from each water point to calculate the area grazed, which in turn is used to calculate carrying capacity. Look for obvious signs of grazing and cattle activity at a number of points away from water and work out the furthest point cattle range. However, it important not to include areas that are outside a realistic grazing distance from water. The distance cattle range will also depend on the livestock’s water requirements. For example, lactating cows won’t graze as far out from water as dry stock and high temperatures can limit the grazing radius diminishes.
- Consider how long the pasture will last. For example, is it made up of perennial grasses rather than annual forbs that will shrivel up and blow away on the first hot day. The quality of the feed and the stage in the plant’s life cycle is also important. Leaves of plants, including grasses, will deteriorate in nutritive value once they begin to flower.
- Estimate the carrying capacity of paddocks as a sum of the carrying capacities for each of the land types in each paddock. If you can estimate or know the proportion of each land type in the paddock, you can work out a total for the paddock.
- Remember that cattle tend to graze (grasses and forbs) at 95% and browse shrubs for the remaining 5%, depending on what feed is available. However, if shrubs make up the largest of the feed component available, then these figures can change dramatically.
How to estimate carrying capacity
There are numerous methods you can use for determining the amount of feed available, use any method which works for you. Refer to Tool 2.03.
Only one method will be discussed here, which is often called the ‘square’ method. It can be used in different land types and is relatively easy to use. You simply estimate the area required to feed one DSE for one day, taking into account all of the above factors ie what the stock will eat, what they won’t eat, how much feed resource you wish to leave behind, your production and natural resource management goals and actions from Module 1: Setting directions.
For this example, we’ll assume that you are estimating the carrying capacity for one paddock, however this method can be extrapolated over the whole property and all paddocks if required.
The general idea is to visualise the area required to feed one DSE for one day. The easiest way to do this is to have at least two people to act as the corner posts of your square. If you are working alone, use posts to plot this square area. Look at the amount of feed in the area you have marked out and ask yourself “Is there enough feed in that area to feed one DSE for one day?” Remember you are aiming for maintenance - no gain or loss of live weight.
What you will have to think about
Try this in the field with family or neighbours. Discuss what plants are in the area, what stock will eat, what they won’t eat, is there enough feed or too much? Keep adjusting the size of the square until you agree that it is about the right size. If you can’t agree, go with the person who wants the biggest area. The biggest square will give you the lowest and most conservative estimate of carrying capacity or Feed on Offer (FOO). Once you have established your square, pace out two sides and record these measurements.
It is better to underestimate the feed available than overestimate it.
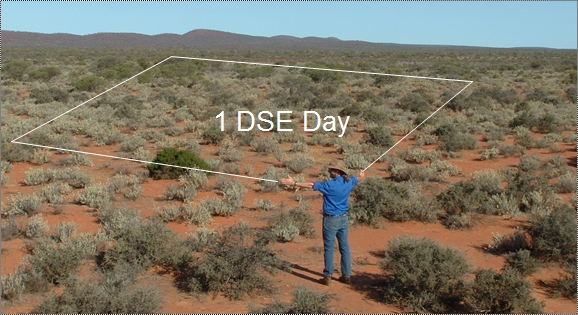
Figure 1: Estimating daily feed requirements for 1 DSE.
As mentioned earlier, you may need to do more than one estimate across the paddock. How many you do will be determined by the land type variability in the paddock, the size of the paddock and the distribution of waters. You also need to consider the nutritional value of the plants for each land type within the paddock.
Working out how many DSE days of FOO there are
Use the example of Jess’s paddock with 2 different land types, described in Table 7.
Once you have made all your estimates and recorded the length of the sides in Column A (see Table 7), work through the following steps.
Step 1. Grab your calculator and work out the size of your square in m2, by multiplying the length of the two sides together eg 17 m x 15 m = 255 m2.
Step 2. Now ask yourself, how many of those squares fit into one hectare? One hectare is 100 metres by 100 metres = 10,000 m2. So to work out how many 255 m2 squares fit into one hectare, simply divide 10,000 by 255.
Column C shows the number of DSE Days of feed available per hectare.
So, for land type 1, there are 39 DSE Days per ha (DDH) of feed available. That means on each hectare there is enough feed for 39 DSEs for 1 day, or 1 DSE for 39 days, or any combination of DSEs and days in between. Do the same for land type 2 (see Table 7).
Table 7: Calculating DSE days per Ha.
|
|
A |
B |
C |
|
Jess’s Paddock |
Length of sides (metres) |
Area of square (m2) |
DSE Days per ha, (10,000 ÷ B) |
|
Land type 1 eg bladder saltbush plains |
17 x 15 |
255 |
39 |
|
Land type 2 eg Dillon Bush plains |
10 x 9 |
90 |
111 |
Step 3. Now we need to work out how many DSE Days of feed are available over the whole grazing area of the paddock. To do that, we need to know how many hectares there are in each land type.
To calculate the DSE days of FOO for land type 1, take Column C in Table 7 and multiply by the number of grazed hectares ie. the area of the land type that is available for grazing (it is not usually the whole paddock due to factors like topography, distance from watering points etc.)
In land type 1 39 DDH x 500 ha = 19,500 DSE Days.
Repeat for land type 2.
Then add up total DSE Days in the paddock as shown in Table 8.
Table 8: Calculating DSE Days.
|
|
DSE Days per ha |
Grazed ha i.e. area available for grazing |
DSE Days of FOO |
|
Land type 1 |
39 |
500 |
19,500 |
|
Land type 2 |
111 |
600 |
66,600 |
|
Total |
|
1,100 |
86,100 |
In this example, we have estimated that there are 86,100 DSE Days of preferred and available feed in Jess’s paddock. Given this, the next step is to determine how many stock we can graze in the paddock, and for how long. Note that lower stocking rates allow more room to move with seasonal variations and encourage higher productivity per head.
Calculating Stocking Rate
In Jess’s paddock there is an estimated 86,100 DSE Days of feed available. We now need to determine if any adjustments are required to the number of stock being run in the paddock. This also relates to the goals and actions your wish to achieve (Module 1).
Some other information to inform this example:
- The feed is required from mid-January to end of May, a total of 135 days.
- There are currently 100 dry cows in the paddock.
- The cows are currently around 400 kg live weight (gaining .25kg/day to ensure successful joining).
- The cows will be joined beginning of Autumn and we are aiming for a 95% calving rate.
Step 1: Plan out the stocking rate for the time that the feed needs to last as shown in Table 9.
Table 9: Calculation of stocking rate in DSE Days for Jess’s Paddock.
|
Row |
|
January |
February |
March |
April |
May |
|
2 |
Days |
15 |
28 |
31 |
30 |
31 |
|
3 |
Cow numbers |
100 |
100 |
100 |
100 |
100 |
|
4 |
Status |
Dry |
Dry |
Dry |
Pregnant* |
Pregnant |
|
5 |
DSE rating |
7 |
7 |
7 |
9 |
9 |
|
6 |
Total DSEs in paddock |
700 |
700 |
700 |
900 |
900 |
|
7 |
Stocking rate DSE Days |
10,500 |
19,600 |
21,700 |
27,000 |
27,900 |
|
8 |
Total DSE Days of feed demand for the 135 days
|
106,700 |
||||
*Assume 100% joining
To do this, firstly write down how many days in each month (Row 2), and then determine the DSE rating to use for each month (Row 5). The DSE rating is based on bodyweight, growth rate and physiological state of the animal.
Then multiply the number of ewes by the monthly DSE rating to give you the total number of DSEs in the paddock for each month (Row 6).
The next step is to then multiply the number of DSEs in the paddock for each month by the days in the month to give you the DSE Days of feed demand for each month (Row 7).
Add up all the DSE Days for each month, and this gives you the expected stocking rate in DSE Days for the next 135 days (Row 8).
Step 2: Determine if there is enough feed to satisfy the demand.
The estimate of FOO was 86,100 DSE Days of feed available, and there is a demand of 106,700 DSE Days. This means that the paddock will be overstocked.
Step 3: So, how many cows need to come out?
The paddock is overstocked by 106,700 – 86,100 = 20,600 DSE Days, so the demand for feed (or stocking rate) needs to be reduced by this amount. The feed needs to last for 135 days so divide 20,600 DSE Days by 135 days, there is 152 DSEs too many in the paddock. The next question is “How many cows need to be removed from the paddock?”
To calculate this, take the number of excess DSEs, (152) and divide by the DSE rating per head. Now, the DSE rating changes over the months, so on the more conservative side, use the lowest DSE rating. This will result in slightly more cows being removed than if you calculate the average DSE rating over the 135 days. So the number of cows to remove from the paddock will be 152 DSEs divided by 7 DSE per head = 21 head.
Other important points:
Note that in calculating this stocking rate, non-domestic grazers such as rabbits; goats; donkeys; camels; horses and kangaroos have not been included. They can make up a significant part of your total grazing pressure.
When planning out your stocking rate, you need to take your livestock productivity goals and actions (Module 1) into account when assigning DSE ratings. If you use anything less, you will not provide sufficient feed for the levels of productivity to be achieved. Your productivity goals and feed budgets must be aligned - if they aren’t, you may have great difficulty achieving them.
You need to determine how significant the number of stock to removed ie how significant is 21 head? Do you have any paddocks available to put these cows? For example, vacant paddocks that have sufficient feed available or do you need to make a decision to sell? All your stocking decisions are interrelated with your productivity and natural resource goals. So you need to look at these decisions in a holistic way.
Livestock productivity goals should be consistent with stocking rate and vice versa.
Further information and resources
Addison, J., Managing Range Condition, Agriculture WA, Kalgoorlie.
Alchin, M., Addison, J.,Shrubb, V., Cockerill, Z., Young, M., Johnson, T., and Brennan, G., 2008, Pastoral Profits Guide – A paddock guide to achieving sustainable livestock productivity, WA Ag.
A national guide to describing and managing beef cattle in low body condition
Hacker, R., Beange, L., Casburn, G., Curran, G., Gray, P. & Warner, J. (2005), Best Management Practices for Extensive Grazing Enterprises, NSW Department of Primary Industries, Orange.
National Research Council (1987), Predicting Feed Intake of Food-Producing Animals, National Academy Press, Washington, D.C.
National Research Council (2000), Nutrient Requirements of Beef Cattle, Animal Nutrition Series, Seventh Revised Edition, National Academies Press, Washington, D.C.
Outback Lakes Group (2009), Best practice nutritional management of grazed pasture plants, Productive Nutrition Pty Ltd.
PRIMEFACT 533, Water for Livestock: Interpreting Water Quality Tests, (2007), NSW Department of Primary Industries.